Candle/Keltner Channels BUY SELLWhy Use Candlesticks?
They help traders visualize price action
Used in technical analysis and price pattern recognition (e.g., Doji, Engulfing, Hammer)
Assist in determining entry and exit points
Why Traders Use Keltner Channels?
Keltner Channels are widely used by traders for identifying trends, detecting volatility, and spotting trade opportunities.
1. Trend Identification
The middle line (EMA) shows the general trend.
If price consistently stays above the middle line, it indicates a strong uptrend.
If price stays below, it signals a downtrend.
Use: Traders follow the trend direction to enter trades in line with momentum.
2. Volatility Measurement
The width of the channel expands and contracts based on Average True Range (ATR).
Wider channels = high volatility, tighter channels = low volatility.
Use: Helps traders decide when to expect breakouts or calm periods.
3. Breakout Signals
A break above the upper band can signal a bullish breakout.
A break below the lower band can signal a bearish breakout.
Use: Traders use this for momentum trading and breakout entries.
4. Overbought/Oversold Conditions
Price touching or crossing the upper band may suggest it's overbought.
Price touching or crossing the lower band may suggest it's oversold.
Use: Traders combine this with RSI or MACD to confirm reversal setups.
5. Trade Entry and Exit
When price pulls back to the middle EMA during a trend, it may present a buy/sell opportunity.
Exits can also be planned if price returns inside the bands after a breakout.
Use: Helps with precise entry and exit timing.
6. Combines Well With Other Indicators
Commonly used with:
RSI (for confirmation)
MACD (for momentum)
Candlestick patterns (for price action signals)
Combining Candlestick Patterns with Keltner Channels gives traders a powerful method to confirm entries, spot reversals, and improve accuracy. Here’s why this combination works so well:
1. Context for Candlestick Signals
Candlestick patterns (like doji, engulfing, or pin bars) show potential price reversals, but they need context to be reliable. Keltner Channels provide that context:
A bullish candlestick near the lower band suggests a stronger buy signal.
A bearish candlestick near the upper band strengthens a sell signal.
2. Filtering False Signals
Candlestick patterns occur frequently, and not all are meaningful.
The location within the Keltner Channel helps filter out weak or false patterns.
Example: A bullish engulfing candle outside the lower band = high-probability reversal.
3. Improved Entry Timing
Traders wait for a candlestick pattern confirmation when price touches or crosses a Keltner band.
This avoids premature entries and allows tighter stop-losses.
4. Better Risk-Reward Setup
Candlestick entry near channel extremes (upper/lower band) lets traders place stop-losses just beyond recent highs/lows.
The target can be the opposite side of the channel or the middle EMA.
5. Visual Simplicity
Keltner Channels + Candles are visually intuitive.
Even beginner traders can easily recognize:
Overextended candles near channel edges.
Confirmed breakouts or reversals.
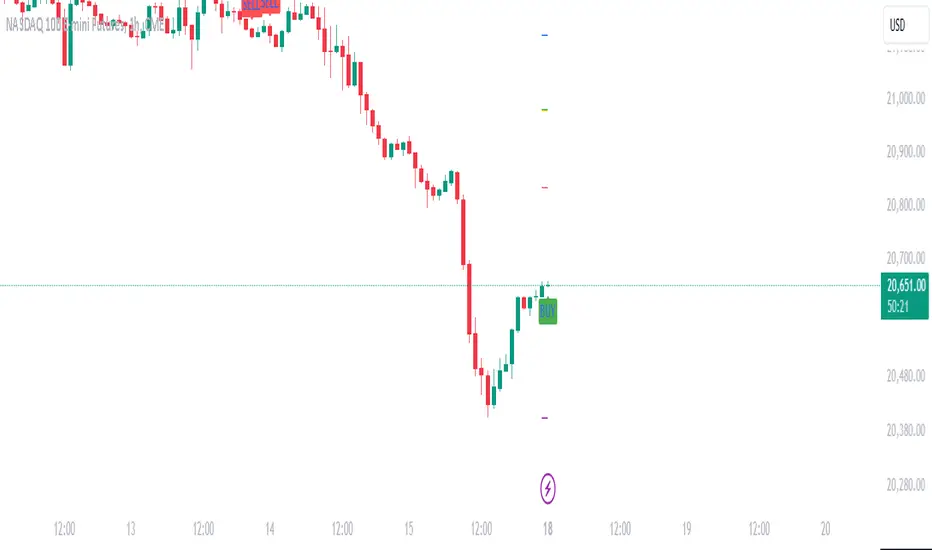
This Timeframe 5 min : XAUUSD
Pesquisar nos scripts por "Buy sell"

RSI Buy Sell Signals[RanaAlgo]Overview
This Premium RSI with Enhanced Signals builds upon the classic Relative Strength Index by incorporating multiple confirmation filters and visual enhancements to improve signal reliability. The indicator goes beyond basic overbought/oversold levels by adding volume confirmation, trend alignment, and peak detection logic.
Key Features
Enhanced Signal Detection
Peak Strength Filter: Requires RSI movements to meet minimum strength criteria (configurable from 1-5 bars)
Volume Confirmation: Optional volume filter to ensure signals occur with above-average trading activity
Trend Alignment: Optional trend confirmation that checks price position relative to 20-period EMA
Visual Improvements
Dynamic coloring of RSI line (green in oversold, red in overbought)
Customizable reference lines and zones
Clear buy/sell signals with triangle markers
Comprehensive info panel showing current RSI status
Alert Capabilities
Ready-to-use alert conditions for both buy and sell signals
Visual and audible alerts when signals trigger
How It Works
Core RSI Calculation: Uses standard RSI formula with configurable length (default 14)
Signal Generation:
Buy signals require either:
RSI rising from oversold with volume/trend confirmation (when enabled)
Simple crossover above oversold level (when filters disabled)
Sell signals require either:
RSI falling from overbought with volume/trend confirmation
Simple crossunder below overbought level
Additional Filters:
Minimum peak strength prevents weak, insignificant movements from generating signals
Volume filter helps confirm institutional participation
Trend filter aligns signals with broader price direction
Usage Instructions
Apply to any chart timeframe (works best on 1H or higher)
Configure settings in the input panel:
Adjust RSI length if needed
Set overbought/oversold levels (default 70/30)
Enable/disable volume and trend filters
Customize visual elements
Signals appear as triangles below/above the RSI line
Use alerts to get notified of new signals
Differentiation from Standard RSI
This indicator adds several layers of confirmation that aren't present in the basic RSI:
Multi-bar momentum requirement for peaks/troughs
Volume validation option
Trend confirmation option
Smoothed RSI line for cleaner visualization
Comprehensive info panel with current status
The combination of these features helps filter out false signals that commonly occur with traditional RSI implementations.

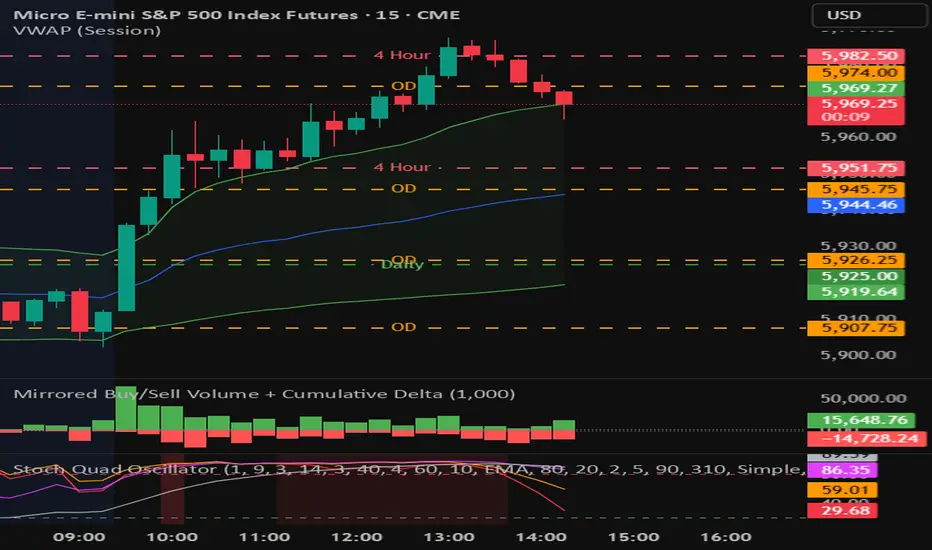
Mirrored Buy/Sell Volume + Cumulative DeltaUser Guide: Mirrored Buy/Sell Volume (Histogram)
🔍 What It Does
Displays green bars above zero for estimated buy volume
Displays red bars below zero for estimated sell volume
Adds a blue line showing Cumulative Delta (buy − sell over time)
Optional threshold lines help spot when net momentum builds up
📊 How Volume is Estimated
Same estimation method as the table version:
Buy Volume is proportion of volume estimated using (close - low) / (high - low)
Sell Volume is remainder of the total volume
Cumulative Delta = running total of (Buy − Sell) volume
This gives you:
A real-time sense of which side is gradually gaining control
More context than looking at candles or volume bars alone
✅ Best For
Visual trade decision support: who’s winning the tug-of-war?
Spotting trend initiation or momentum shifts
Combining with oscillator/trend tools for confirmation
⚠️ Limitations
Still an approximation — not based on actual trade aggressor data
Cannot separate passive vs. aggressive orders
Cumulative Delta does not reset unless specifically coded to do so
May mislead if the bar has long wicks or closes near midpoint
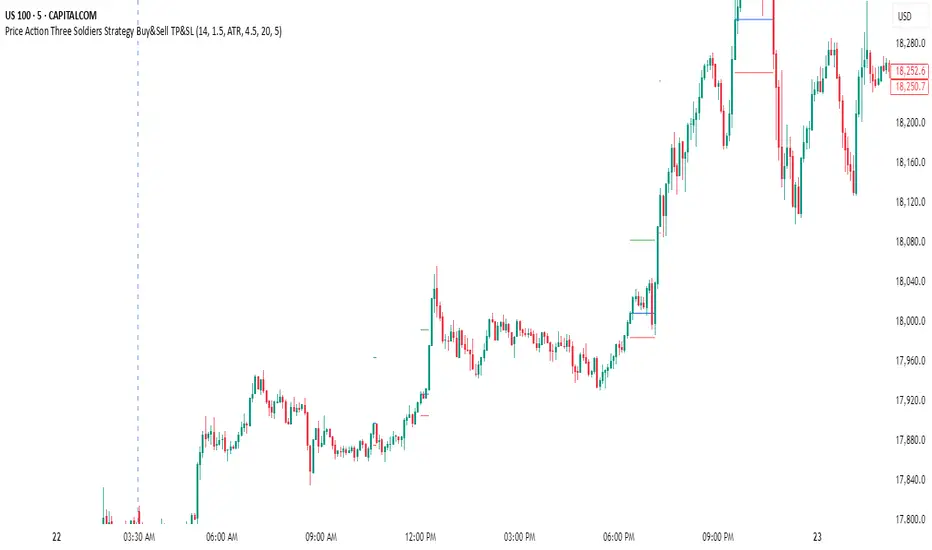
Price Action Three Soldiers Strategy Buy&Sell TP&SLStrategy Overview:
This indicator detects a "Three White Soldiers" bullish pattern to suggest potential buy opportunities. It uses dynamic Stop Loss (SL) and Take Profit (TP) management, based on either market volatility (ATR) or liquidity zones.
This tool is intended for educational and informational purposes only.
📈 Key Features:
Entry: Based on detecting Three White Soldiers candle pattern.
Exit: Targets are managed through ATR multiples or previous liquidity levels (swing highs).
Smart Liquidity: Optionally identify deeper liquidity targets.
Full Alerts: Buy and Sell signals supported with customizable alerts.
Visualized Trades: Entry, SL, and TP levels are plotted on the chart.
⚙️ User Inputs:
ATR Length, ATR Multipliers
Take Profit Mode (Liquidity/ATR)
Swing Lookback and Strength
Toggleable Buy/Sell alerts
📖 How to Use:
Add the Indicator:
Apply the script to your chart from the TradingView indicators panel.
Look for Buy Signals:
A buy signal is triggered when the script detects a "Three White Soldiers" bullish pattern.
Entry, Stop Loss, and Take Profit levels are plotted automatically.
Choose Take Profit Mode:
ATR Mode: TP is based on a volatility target.
Liquidity Mode: TP is based on past swing highs.
Set Alerts (Optional):
Enable Buy/Sell alerts in the settings to receive real-time notifications.
Practice First:
Always backtest and paper trade before live use.
📜 Disclaimer:
This script does not offer financial advice.
No guarantees of profit or performance are made.
Use in demo accounts or backtesting first.
Always practice proper risk management and seek advice from licensed professionals if needed.
✅ Script Compliance:
This script is designed in full accordance with TradingView’s House Rules for educational tools.
No financial advice is provided, no performance is guaranteed, and users are encouraged to backtest thoroughly.
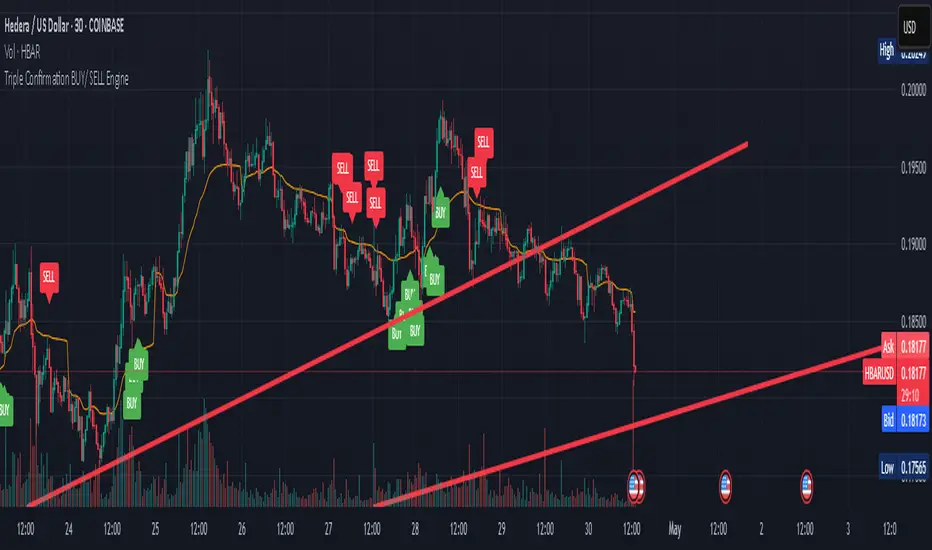
Triple Confirmation Buy/Sell Engine VWAP + MACD + RSIDescription:
This custom-built indicator generates high-confidence Buy/Sell signals using a powerful combination of MACD momentum, RSI strength, and VWAP trend confirmation — designed for cleaner entries and fewer false signals.
Unlike traditional scripts that rely on only one indicator (and produce noisy or early signals), this system requires triple confirmation, greatly increasing signal quality and reducing false trades.
✅ Buy Signal Conditions:
MACD histogram turns green (momentum shift positive)
RSI crosses above 50 (bullish strength confirmation)
Price closes above VWAP (trend confirmation)
🔻 Sell Signal Conditions:
MACD histogram turns red (momentum shift negative)
RSI crosses below 50 (weakening trend)
Price closes below VWAP (bearish confirmation)
🛠 Best For:
Trend traders seeking higher probability entries
Swing traders who want to catch bigger moves
Crypto, stocks, forex traders looking for simple, effective signals
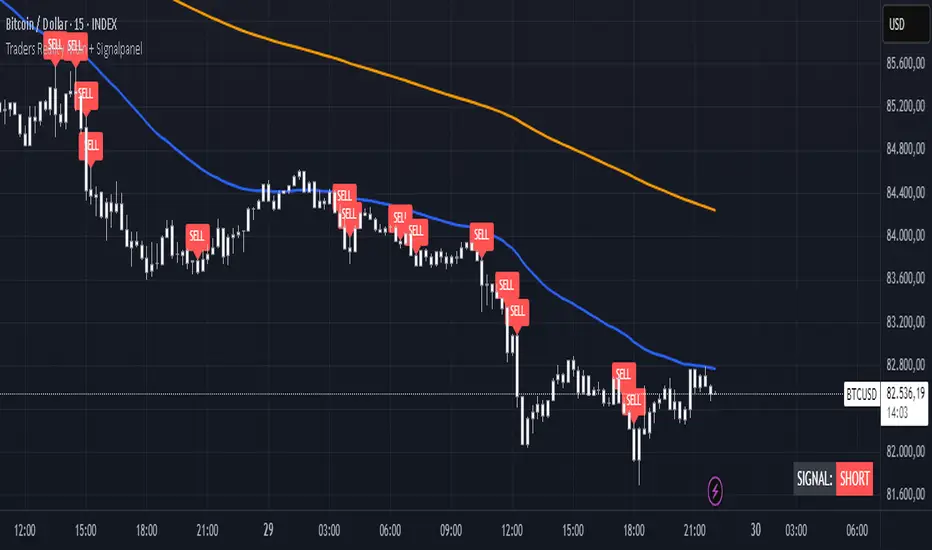
TR Buy/Sell Signal PanelI scripted this with chatgpt have fun guys
📊 TR Buy/Sell Signal Panel – Smart Trade Signals with Visual Clarity
The TR Buy/Sell Signal Panel is a standalone indicator inspired by the powerful Traders Reality (TR) methodology.
It detects potential long and short trade setups using classic market behavior patterns such as volume spikes, EMA crossovers, and session-based timing – all visualized cleanly and statically on your chart.
✅ Key Features
Buy Signals (LONG):
Green PVSRA candle (strong bullish candle with momentum)
EMA13 crossing above EMA50
Volume spike (current volume exceeds 20-period average × multiplier)
Triggered only during London or New York trading sessions (UTC)
Sell Signals (SHORT):
Red PVSRA candle (strong bearish move)
EMA13 crossing below EMA50
Volume spike
Also restricted to active session times
📌 Visual Components
Green/Red arrows on the chart indicate Buy/Sell entries
A static info panel in the bottom-right corner displays all signal conditions:
PVSRA active ✅
Volume Spike ✅
EMA Crossover ✅
Session Time ✅
Last Signal: 🟢 BUY / 🔴 SELL
Current Direction: 🟢 LONG / 🔴 SHORT / ❌ NONE
⚙️ Fully Customizable
Adjustable volume spike multiplier
Optional toggle for showing/hiding short signals
Extremely user-friendly layout – ideal for both beginners & experienced traders
📦 Best For:
Scalpers & Intraday Traders
Traders who follow the Traders Reality / Market Maker Method
Anyone who values clean, rule-based trade entries
Note: Works across all timeframes with sufficient volume (e.g., 5min – 4hr). Sessions are based on UTC time – adjust if needed based on your timezone or trading hours.
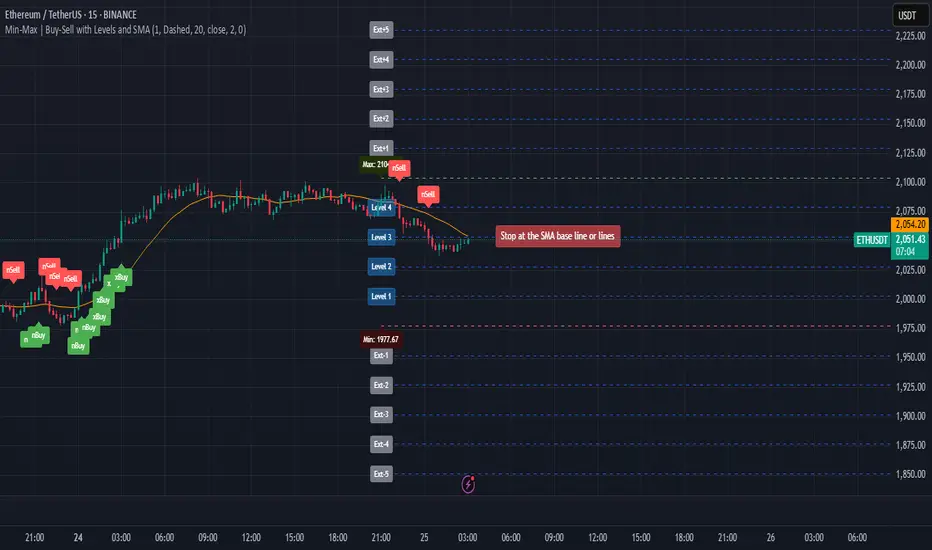
Min-Max | Buy-Sell Alert with LevelsMin-Max | Buy-Sell Alert with Levels
Description:
The Min-Max | Buy-Sell Alert with Levels indicator is a powerful tool designed to help traders identify key levels of support and resistance based on the previous day's high and low prices. It plots horizontal lines for the previous day's minimum (Min) and maximum (Max) prices, along with four intermediate levels (Stop Loss 1 to Stop Loss 4) calculated as equal percentage steps between the Min and Max.
This indicator is perfect for traders who want to:
Identify potential entry points when the price returns within the Min-Max range.
Set stop-loss levels based on the calculated intermediate levels.
Receive alerts for buy, sell, and stop-loss conditions.
Key Features:
Previous Day's Min and Max Lines:
Automatically plots the Min (red line) and Max (green line) of the previous day.
These levels act as dynamic support and resistance zones.
Intermediate Stop Loss Levels:
Calculates and plots four intermediate levels (Stop Loss 1 to Stop Loss 4) between the Min and Max.
Each level is equally spaced, representing potential stop-loss or take-profit zones.
Customizable Alerts:
Buy Alert: Triggered when the price returns within the Min-Max range after breaking below the Min.
Sell Alert: Triggered when the price returns within the Min-Max range after breaking above the Max.
Stop Loss Alerts: Triggered when the price reaches any of the four intermediate levels (Stop Loss 1 to Stop Loss 4).
Customizable Appearance:
Adjust the thickness, color, and style (solid, dashed, dotted) of the lines.
Customize the colors of the Stop Loss labels for better visualization.
Labels on the Chart:
Displays "Buy" and "Sell" labels on the chart when the respective conditions are met.
Labels for Stop Loss levels are also displayed for easy reference.
How to Use:
Add the indicator to your chart.
Customize the settings (line colors, thickness, and alert preferences) in the indicator's settings panel.
Use the Min and Max lines as dynamic support and resistance levels.
Monitor the intermediate levels (Stop Loss 1 to Stop Loss 4) for potential stop-loss or take-profit zones.
Set up alerts for Buy, Sell, and Stop Loss conditions to stay informed about key price movements.
Why Use This Indicator?
Simple and Effective: Focuses on the most important levels from the previous day.
Customizable: Tailor the indicator to match your trading style and preferences.
Alerts: Never miss a trading opportunity with customizable alerts for key conditions.
Settings:
Line Thickness: Adjust the thickness of the Min, Max, and intermediate lines.
Line Colors: Customize the colors of the Min, Max, and intermediate lines.
Line Style: Choose between solid, dashed, or dotted lines.
Stop Loss Label Colors: Customize the colors of the Stop Loss labels.
Alerts: Enable or disable alerts for Buy, Sell, and Stop Loss conditions.
Ideal For:
Day traders and swing traders.
Traders who rely on support and resistance levels.
Anyone looking for a clear and customizable tool to identify key price levels.
Disclaimer:
This indicator is for educational and informational purposes only. It does not constitute financial advice. Always conduct your own analysis and trade responsibly.
Get Started Today!
Add the Min-Max | Buy-Sell Alert with Levels indicator to your chart and take your trading to the next level. Customize it to fit your strategy and never miss a key trading opportunity again!
EMA Clouds with Strict Buy/Sell SignalsEMA Clouds with Strict Buy/Sell Signals - Precision Trading Unleashed
Unlock the power of trend-following precision with the EMA Clouds with Strict Buy/Sell Signals indicator, a sophisticated tool built for traders who demand reliability and clarity in their decision-making. Inspired by the legendary Ripster EMA Clouds, this indicator takes the classic cloud concept to the next level by incorporating stricter, high-confidence signals—perfect for navigating the markets on 15-minute or higher timeframes.
Why You’ll Want This on Your Chart:
Dual EMA Clouds for Crystal-Clear Trends: Watch as two dynamic clouds—formed by carefully paired Exponential Moving Averages (8/21 and 34/50)—paint a vivid picture of market momentum. The green short-term cloud and red long-term cloud provide an intuitive, at-a-glance view of trend direction and strength.
Stricter Signals, Fewer False Moves: Tired of chasing weak signals? This indicator only triggers buy and sell signals when the stars align: a cloud crossover (short-term crossing above or below long-term) and price confirmation above or below both clouds. The result? Fewer trades, higher conviction, and a cleaner chart.
Customizable Timeframe Power: Whether you’re a scalper on the 15-minute chart or a swing trader on the daily, tailor the clouds to your preferred higher timeframe (15min, 30min, 1hr, 4hr, or daily) for seamless integration into your strategy.
Visual Mastery Meets Actionable Alerts: Green buy triangles below the bars and red sell triangles above them make spotting opportunities effortless. Pair this with built-in alerts, and you’ll never miss a high-probability trade again.
How It Works:
Buy Signal: Triggers when the short-term cloud crosses above the long-term cloud and the price surges above both, signaling a robust bullish breakout.
Sell Signal: Activates when the short-term cloud dips below the long-term cloud and the price falls beneath both, confirming bearish dominance.
Cloud Visualization: The green cloud (8/21 EMA) tracks fast-moving trends, while the red cloud (34/50 EMA) anchors the broader market direction—together, they filter noise and spotlight tradable moves.
Why Traders Will Love It:
Designed for those who value precision over guesswork, this indicator cuts through market clutter to deliver signals you can trust. Whether you’re trading stocks, forex, crypto, or futures, its adaptability and strict logic make it a must-have tool for serious traders. Customize the EMA lengths, tweak the timeframe, and watch your edge sharpen.
Add EMA Clouds with Strict Buy/Sell Signals to your chart today and experience the confidence of trading with a tool that’s as disciplined as you are. Your next big move is waiting—don’t let it slip away.

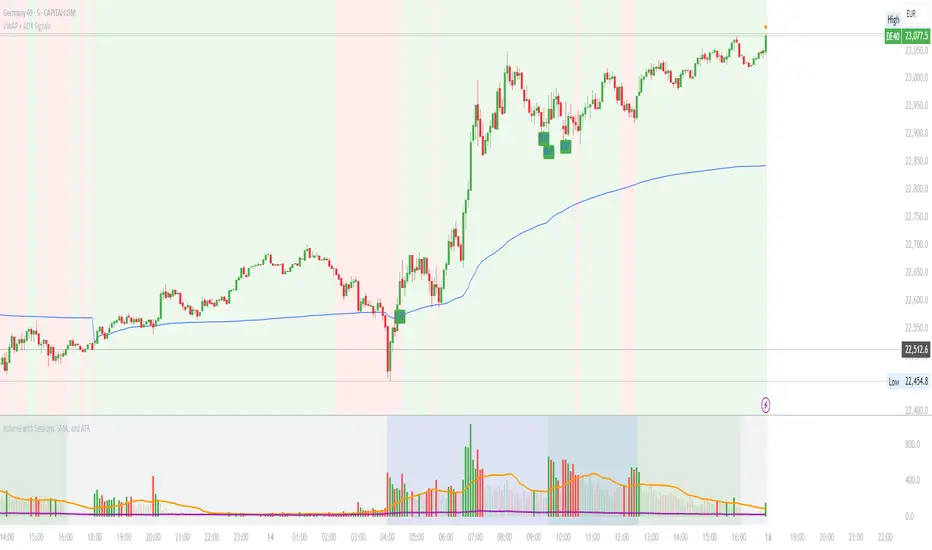
VWAP with ADX Buy/Sell Signals and 50 MA BackgroundThis Pine Script combines several technical indicators to create a comprehensive chart with buy and sell signals based on the ADX and VWAP, as well as background color changes depending on the price relative to the 50-period simple moving average (SMA). Here's a breakdown of what each part of the code does:
1. VWAP Settings
Anchor Period: You can select different periods such as "Session", "Week", "Month", etc. to define the anchor period for the VWAP.
Source: The source for VWAP is set to the typical price (hlc3).
Offset: Allows for shifting the VWAP by a specified amount.
2. ADX Settings
ADX Length: The period used to calculate the ADX.
ADX Smoothing: Used to smooth the ADX for better clarity.
ADX Threshold: Used to filter out weak trends (i.e., signals when ADX > 20).
3. ADX and VWAP Calculation
The ADX values are calculated using ta.dmi(), which returns the +DI, -DI, and ADX lines.
VWAP is calculated using ta.vwap(), based on the selected price source.
4. Buy/Sell Conditions
Buy Signal: A buy signal is generated when:
The +DI crosses above the -DI (indicating an uptrend).
The ADX is above 20 (indicating a strong trend).
The closing price is above the VWAP (indicating bullish market sentiment).
Sell Signal: A sell signal occurs when:
The -DI crosses above the +DI (indicating a downtrend).
The ADX is above 20 (indicating a strong trend).
The closing price is below the VWAP (indicating bearish market sentiment).
5. VWAP Bands
The standard deviation of the price is calculated using ta.stdev(), and the bands are plotted at multiples of the standard deviation (1, 2, and 3).
These bands are used to highlight possible overbought or oversold conditions.
6. 50-period SMA and Background Color
The script calculates a 50-period Simple Moving Average (SMA).
The background color is then changed based on whether the price is above or below the 50-period SMA. If the price is above the SMA, the background is green (bullish), and if it’s below, it’s red (bearish).
7. Plots
The script includes plots for the VWAP line, the ADX and DI lines (optional), and the upper and lower bands.
The buy and sell signals are plotted as shapes with text labels ("BUY" and "SELL") that appear below or above the price bars.
Final Notes:
Band Plots: Three levels of bands (green, olive, teal) are plotted using standard deviation multipliers (1, 2, and 3 times the standard deviation).
Background Color: The background color changes depending on whether the price is above or below the 50 SMA, giving a visual cue for bullish or bearish market conditions.
This indicator aims to offer a multi-faceted view of the market with trend-following signals (via ADX), VWAP for intraday support/resistance, and background coloring to indicate the current trend strength based on the 50 SMA.
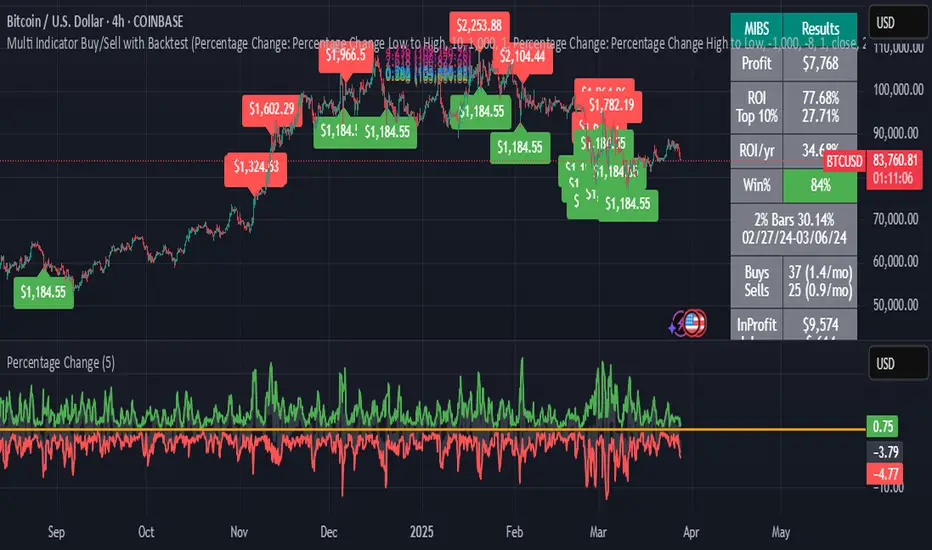
Multi Indicator Buy/Sell with BacktestThis backtest indicator allows you to configure up to 4 different indicators and set buy/sell levels for each one, then back test how well your strategy would have worked over a given time period.
3x Supertrend + EMA200 Signal Buy/Sell [nsen]The indicator uses signals from three Supertrend lines to determine whether to trade Buy or Sell, with the assistance of a moving average for bias.
Buy/Sell signals are generated when the conditions are met:
A Buy signal is triggered when all three Supertrend lines indicate a bullish trend and are above the EMA.
A Sell signal is triggered when all three Supertrend lines indicate a bearish trend and are below the EMA.
Indicator ใช้สัญญาณจาก Supertrend ทั้งหมด 3 เส้น โดยใช้ในการกำหนดว่าจะเลือกเทรด Buy หรือ Sell โดยการใช้ moveing average เข้ามาช่วยในการ bias
แสดงสัญญาณ Buy/Sell เมื่อเข้าเงื่อนไข
- Supertrend ทั้ง 3 เส้นเป็นสัญญาณ Bullish และอยู่เหนือเส้น EMA จะเปิดสัญญาณ Buy
- Supertrend ทั้ง 3 เส้นเป็นสัญญาณ Bearish และอยู่ใต้เส้น EMA จะเปิดสัญญาณ Sell

RSI with Bollinger Bands and Buy/Sell SignalsPurpose:
This indicator combines the Relative Strength Index (RSI) with Bollinger Bands to identify overbought and oversold conditions in the market. It also generates buy and sell signals based on the interaction between the RSI and the Bollinger Bands. It is particularly useful for traders looking for opportunities in volatile or trending markets.
How It Works:
RSI (Relative Strength Index):
The RSI measures the magnitude of recent price changes to evaluate whether an asset is overbought (values > 70) or oversold (values < 30).
In this indicator, horizontal lines at levels 70 (overbought) and 30 (oversold) are used as reference points.
Bollinger Bands:
Bollinger Bands are calculated around a smoothed moving average of the RSI. The upper band represents dynamic overbought levels, while the lower band indicates dynamic oversold levels.
These bands automatically adjust their width based on the volatility of the RSI, allowing them to adapt to different market conditions.
Buy and Sell Signals:
Buy Signal: A buy signal is generated when the RSI exceeds both the upper Bollinger Band and the overbought level (70). This suggests that the asset is in an extreme bullish phase.
Sell Signal: A sell signal is generated when the RSI falls below both the lower Bollinger Band and the oversold level (30). This suggests that the asset is in an extreme bearish phase.
Alerts:
The indicator includes automatic alerts to notify you when buy or sell signals are generated. This allows traders to act quickly on new opportunities.
Best Practices:
Confirmation in Lower Timeframes:
Although this indicator is powerful, it is recommended to confirm signals in lower timeframes before making trading decisions. For example:
If you receive a buy signal on a 4-hour chart, check if the RSI and Bollinger Bands on lower timeframes (such as 1 hour or 15 minutes) also show bullish signals.
This reduces the risk of false positives and increases the accuracy of your entries.
Use in Trends:
This indicator works best in markets with clear trends. In sideways or low-volatility markets, signals may be less reliable due to the lack of directional momentum.
Risk Management:
Always use stop-loss and take-profit to protect your positions. Buy and sell signals are just one tool for analysis; they do not guarantee results.
Combination with Other Indicators:
To improve accuracy, consider combining this indicator with others, such as MACD, Stochastic Oscillator, or Japanese candlestick patterns. This can provide additional confirmation before opening a position.
Summary:
The RSI + Bollinger Bands with Buy/Sell Signals indicator is an advanced tool designed to identify entry and exit points in the market based on extreme overbought and oversold conditions. However, to maximize its effectiveness, it is crucial to confirm signals in lower timeframes and use it in combination with other technical analysis tools. With proper risk management and careful interpretation of signals, this indicator can be a valuable ally in your trading strategy.

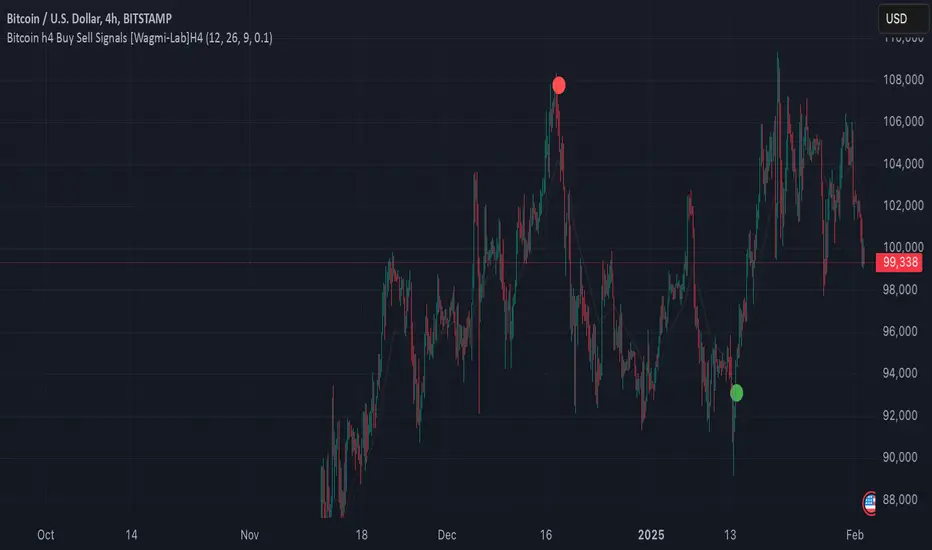
Wagmi Lab- Bitcoin H4 Buy Sell Signals This indicator, designed primarily for Bitcoin on the H4 timeframe, is a versatile tool that can also be applied to other assets and timeframes by adjusting its parameters. It combines Exponential Moving Averages (EMAs), MACD (Moving Average Convergence Divergence), and a crossover filtering mechanism to generate reliable buy and sell signals. The indicator is ideal for traders looking to identify trend direction and potential entry/exit points with added precision.
Key Features:
Customizable EMAs and MACD:
Fast EMA (default: 12): Tracks short-term price momentum.
Slow EMA (default: 26): Tracks long-term price momentum.
Signal SMA (default: 9): Smooths the MACD line to generate the signal line.
MACD Crossover Signals:
The indicator calculates the MACD line and signal line to identify potential buy and sell opportunities.
Buy signals are generated when the MACD line crosses above the signal line, indicating bullish momentum.
Sell signals are generated when the MACD line crosses below the signal line, indicating bearish momentum.
Crossover Strength Filter:
A minimum crossover distance percentage (default: 0.1%) ensures that only significant crossovers are considered, reducing false signals.
This filter helps traders avoid weak or insignificant crossovers that may not lead to strong price movements.
Trend Visualization:
The indicator highlights the trend direction by filling the area between the fast and slow EMAs with colors:
Green: Uptrend (MACD > Signal Line).
Red: Downtrend (MACD < Signal Line).
Buy/Sell Signal Markers:
Buy signals are marked with green circles below the price bars.
Sell signals are marked with red circles above the price bars.
These markers provide clear visual cues for potential entry and exit points.
Adaptable to Other Timeframes and Assets:
While optimized for the H4 timeframe, the indicator can be adjusted for other timeframes (e.g., M15, H1, D1) by modifying the EMA and SMA settings.
It can also be applied to other assets, such as stocks, forex, or commodities, by tweaking the parameters to suit the asset's volatility and characteristics.
How to Use:
Identify Trends:
Use the colored areas (green for uptrend, red for downtrend) to determine the overall market direction.
Wait for Confirmation:
Look for buy or sell signals (green or red circles) that align with the trend direction.
Ensure the crossover meets the minimum distance requirement to filter out weak signals.
Enter and Exit Trades:
Enter a long position when a buy signal appears during an uptrend.
Enter a short position or exit a long position when a sell signal appears during a downtrend.
Adjust Settings for Other Timeframes/Assets:
Experiment with the EMA and SMA periods to optimize the indicator for different timeframes or assets.
Why Use This Indicator?
Precision: The crossover strength filter reduces noise and false signals.
Versatility: Works across multiple timeframes and assets with customizable settings.
Visual Clarity: Clear trend visualization and signal markers make it easy to interpret.
This indicator is a powerful tool for traders seeking to capitalize on Bitcoin's volatility or other assets' price movements, providing a structured approach to identifying trends and potential trading opportunities.
Rabbit Moves - Buy Sell Signals (No Repaint)The Rabbit Moves - Buy Sell Signals (No Repaint) is a powerful TradingView indicator designed to help traders identify potential buy and sell opportunities in the market. By combining the RSI (Relative Strength Index), EMA (Exponential Moving Average), and momentum analysis, this indicator provides clear entry signals for bullish and bearish market movements.
Unlike many repainting indicators, Rabbit Moves ensures reliability by locking in signals once they appear, preventing misleading backtesting results.
How It Works
1. RSI: The Relative Strength Index (RSI) measures the magnitude of recent price changes to evaluate overbought or oversold conditions. A crossover above 50 signals potential bullish momentum, while crossing below 50 suggests bearish momentum.
2. EMA: The Exponential Moving Average (EMA) is used to smooth price data and generate dynamic support or resistance levels. A crossover above the EMA indicates a bullish condition, while a cross below suggests a bearish condition.
3. Momentum: The momentum indicator measures the rate of change of the price and confirms whether the trend is strengthening (bullish) or weakening (bearish).
4. Buy/Sell Percentage:
o The indicator calculates the Buy (Bullish) and Sell (Bearish) probabilities based on the lookback period, which analyzes recent price action to determine how often the market has closed in either direction.
o The Buy Percentage is calculated by determining the number of times the price moved upwards in the past lookback bars, expressed as a percentage of the total observations.
o The Sell Percentage is the inverse, showing the percentage of times the price moved down in the same lookback period.
o These percentages help you assess the likelihood of the next candlestick closing in the predicted direction (up or down), offering additional confirmation for your trades.
Additionally, the indicator calculates the probability of bullish or bearish moves within a defined lookback period. These probabilities are displayed on the chart as percentages, helping traders assess market sentiment.
How to Use the Indicator
1. How to Access
o Kindly check out authors instructions, how you can access this indicator
2. Interpreting the Signals
o Green upward arrow → Indicates a potential buy signal.
o Red downward arrow → Indicates a potential sell signal.
o Probability Display → Shows the likelihood of bullish vs. bearish movements based on historical data.
3. Enhancing Your Strategy
o Use this indicator in combination with support & resistance levels, volume analysis, and price action for better accuracy.
o Apply risk management techniques, such as stop-loss orders and position sizing, to minimize losses.
Why Use This Indicator?
✅ No Repainting – Ensures accurate backtesting and real-time reliability.
✅ Probability-Based Insights – Helps gauge market sentiment before making a trade.
✅ Combines Multiple Technical Factors – Increases accuracy by using RSI, EMA, and momentum together.
✅ Easy-to-Use Signals – Clear buy/sell alerts with visual representation on the chart.
This indicator is designed to work on Forex, Crypto, Stocks, and other financial markets.
Disclaimer:
This indicator is intended solely for educational and informational purposes. It does not constitute financial or investment advice. Trading in financial markets involves significant risk, and past performance is not indicative of future results. Users are responsible for their own trading decisions and should carefully evaluate their risk tolerance and objectives. Always seek professional financial advice before engaging in trading activities.

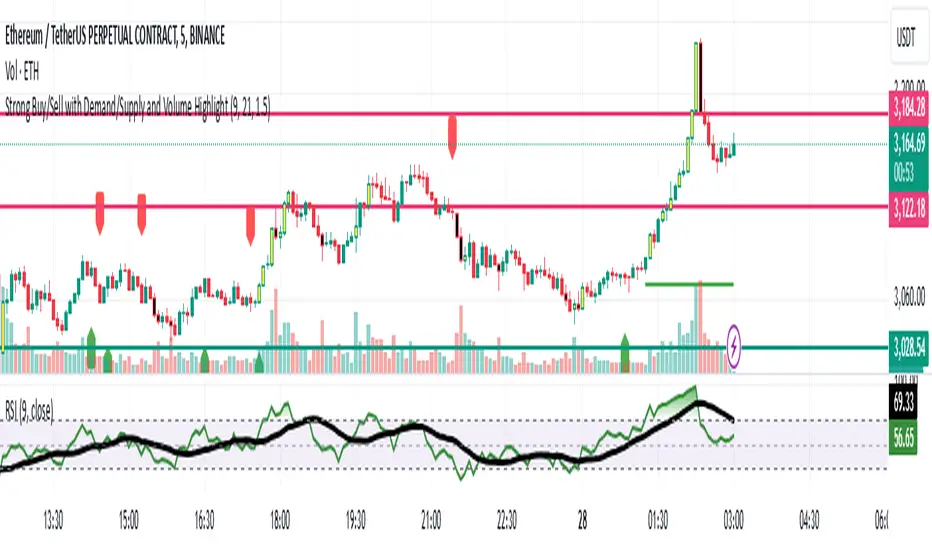
Strong Buy/Sell with Demand/Supply and Volume HighlightStrong Buy/Sell with Demand/Supply and Volume Highlight
This indicator combines key technical elements to provide traders with robust buy and sell signals while highlighting significant market zones and volume trends. It's designed for traders seeking clarity and precision in their decision-making process.
Features:
Dynamic Buy/Sell Signals:
Utilizes the crossover of a fast EMA (default: 9) and a slow EMA (default: 21) to generate reliable buy and sell signals.
Buy signals are marked with green upward labels, while sell signals are marked with red downward labels.
Demand and Supply Zone Detection:
Automatically plots demand (support) and supply (resistance) zones based on recent price movements when buy or sell signals are triggered.
Zones are visually marked with lines for quick identification of key price levels.
Volume Analysis:
Highlights candles with high volume relative to the average 20-period volume (adjustable via the volume multiplier input).
High-volume bullish candles are marked green, and bearish candles are marked red, allowing traders to spot significant market activity instantly.
Inputs:
EMA Periods: Customizable fast and slow EMA settings to adjust signal sensitivity.
Demand/Supply Zones: Option to toggle the visibility of demand and supply levels.
Volume Multiplier: Control the threshold for detecting high-volume candles.
How to Use:
Buy Opportunities: Look for buy signals when the fast EMA crosses above the slow EMA, supported by demand zones and high volume.
Sell Opportunities: Observe sell signals when the fast EMA crosses below the slow EMA, reinforced by supply zones and bearish high-volume candles.
Combine this indicator with your trading strategy to enhance decision-making and improve trade timing.
This indicator is suitable for multiple timeframes and markets, making it a versatile tool for scalpers, day traders, and swing traders.
VWMA with Buy/Sell Signalshe VWMA (Volume Weighted Moving Average) is a technical indicator that averages prices over a specified period while giving more weight to periods with higher trading volumes. This makes the VWMA more sensitive to price movements during high-volume trading compared to a simple moving average (SMA).
Adding Buy/Sell Signals to a VWMA-based script involves identifying trends or crossover points that indicate potential entry (Buy) or exit (Sell) opportunities.
Core Features of the Script:
VWMA Calculation:
Uses the typical price ((High + Low + Close) / 3) or closing price for computation.
Weighting is based on the volume traded in each period.

Supertrend with Buy/Sell SignalsThis simple Supertrend with Buy/Sell Signals is a trend-following indicator that helps identify market direction and potential entry/exit points. It uses the Average True Range (ATR) to calculate a dynamic support and resistance line:
Buy Signal: A green "BUY" label appears when the price crosses above the Supertrend line, indicating a possible bullish trend.
Sell Signal: A red "SELL" label appears when the price crosses below the Supertrend line, signaling a potential bearish trend.
The indicator also adapts to market volatility and displays the trend line in green for uptrends and red for downtrends. It is best used in trending markets.

BS | Buy&Sell Signals With EMAKey Features:
EMA Intersections: Generates clear buy and sell signals based on predefined EMA crossings.
5 EMA Lines: Visualize market trends with five distinct EMA lines plotted on the chart.
Support and Resistance Levels: Easily identify crucial support and resistance levels with our integrated marker.
Comprehensive Indicator Panel: At the bottom of the chart, track Stochastic, RSI, Supertrend, and SMA across multiple timeframes (1m, 5m, 15m, 1H, 4H, Daily, Weekly).
Fully Customizable: Almost every indicator within the tool is adjustable to suit your preferences and trading style.
Alarm Feature: Set up alarms to stay informed of important market movements.
Unlock the full potential of your trading strategy with BS | Buy&Sell Signals With EMA. Customize, analyze, and trade with confidence.
created by @bahadirsezer

RSI Buy-Sell Indicator - MissouriTimThe RSI Buy-Sell Indicator by MissouriTim, is an advanced trading tool designed to elevate your trading strategy. This indicator leverages the power of the Relative Strength Index (RSI) to provide clear and actionable buy and sell signals, ensuring you make informed trading decisions with confidence.
Key Features:
Customizable RSI Settings: Tailor the RSI source, length, and thresholds for overbought and oversold conditions to fit your trading style.
Real-Time Alerts: Enable BUY and SELL alerts to receive instant notifications when market conditions meet your criteria.
Visual Clarity: Easily distinguish between buy and sell signals with customizable line colors, ensuring you never miss a trading opportunity.
Intelligent Labeling: Buy and Sell labels dynamically update to reflect overbought and oversold current market conditions, providing you with clear entry and exit points.
Swing Lines: Visualize price movements with intuitive swing lines that connect recent highs and lows, helping you spot trends and reversals.
How It Works:
The RSI Buy-Sell Indicator utilizes the RSI and a specially designed algorithm to determine when an asset is overbought or oversold. When the RSI value crosses the specified overbought or oversold thresholds, the indicator generates a signal, displayed as a label on the chart. Additionally, swing lines are drawn to connect recent highs and lows, offering a visual representation of market trends.
This tool is perfect for traders who want to enhance their technical analysis and make more informed decisions. With its customizable settings and real-time alerts, the RSI Buy-Sell Indicator by MissouriTim is a must-have for any serious trader.
MACD Buy/Sell Labels + Barcolor👉 MACD Buy/Sell Labels + Barcolor
This advanced indicator combines the functionality of the MACD (Moving Average Convergence Divergence) with intuitive and customizable visual features, making it ideal for traders looking for an efficient tool to confirm buy and sell signals across any market.
It is based on the logical interpretation of a modified oscillator to improve its performance and simplify its usage. The indicator integrates seamlessly into the chart, offering an intuitive and easy-to-understand experience.
📍 Labels (Buy/Sell):
The signals are generated automatically by crossovers between the Fast EMA and Slow EMA of the Gaussian MACD. It comes with a default configuration designed to favor clean crossovers while avoiding false signals.
🧪 Barcolor:
The color of the candles dynamically changes according to the range of the Gaussian MACD histogram. This allows for a clear visualization of the MACD's status without needing to display the full oscillator. This feature integrates with the labels, as explained in the "Interpretation" section, to significantly increase their probability of success. Both the ranges and colors are fully customizable through the settings panel.
⚙️ Settings:
All aspects of the indicator can be customized:
1-MACD: Like a standard MACD, you can adjust the EMA lengths and the signal smoothing to adapt it to your trading style and the markets you trade.
2-Barcolor: The predefined values highlight extreme levels for proper interpretation, as explained in the "Interpretation" section. However, intermediate levels are also included in case you want to implement them in your strategy. You can adjust these values based on what you consider "overbought" or "oversold." This flexibility allows adaptation to various assets, as oscillator behavior varies across different instruments.
3-Buy/Sell Filter:
The filter settings allow you to further refine the signals. The default values of -70 (Buy Filter) and 80 (Sell Filter) work best for me, but you can adjust them as you see fit. Keep in mind:
-Higher distance from zero: More filtered signals (fewer, but higher quality).
-Closer to zero: Less filtered signals (more frequent, but with increased risk of false signals).
🤔 Interpretation:
As mentioned earlier, this follows the classic interpretation of a MACD oscillator: overbought/oversold levels combined with crossovers. However, the barcolor variable is what makes this indicator truly unique.
With barcolor, you can detect potential divergences and confirm them using the labels. When the oscillator reaches an extreme zone, barcolor provides a visual alert. Once the oscillator exits this zone, the candles revert to their normal color. This signals that the oscillator is dropping. If the price continues rising, this divergence can indicate an anomaly in the market. Waiting for confirmation from the label increases the probability of successful trades while detecting unusual market deviations without even looking at the oscillator.
Purpose:
This indicator is designed to help traders simplify the interpretation of the MACD. It can be used on any timeframe, but it was primarily tested using technical analysis concepts and basic liquidity principles. Its effectiveness improves significantly if you understand broader market dynamics.
Disclaimer:
This is purely an analytical tool and should NOT be considered as trading signals. Perform your own research and make decisions based solely on your responsibility. Thank you!

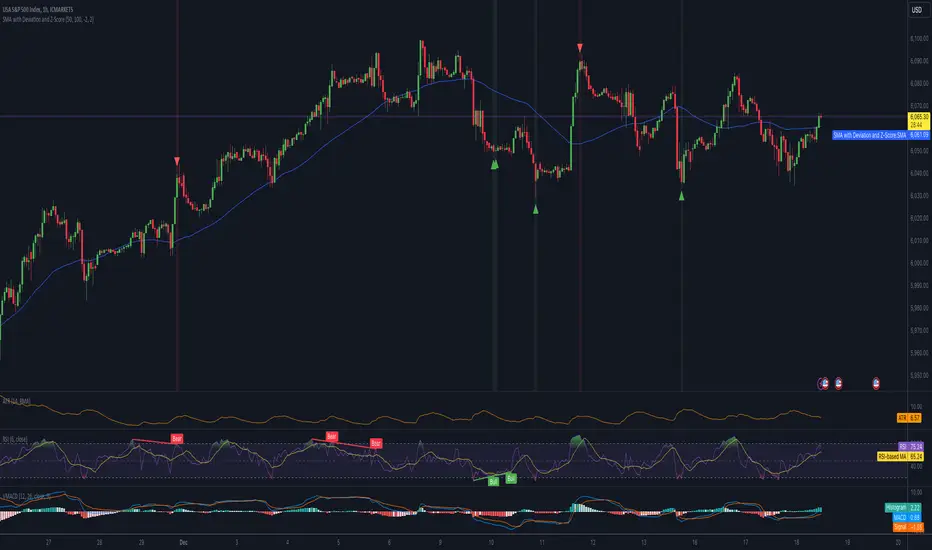
Mean Reversion IndicatorSMA with Deviation and Z-Score Indicator
Overview:
This indicator combines the Simple Moving Average (SMA) with statistical measures of price deviation to identify potential buy and sell signals based on mean reversion principles. It calculates the Z-Score, which quantifies how far the current price is from its moving average in terms of standard deviations, helping traders spot when an asset might be overbought or oversold.
Key Features:
SMA Calculation: Uses a user-defined period to compute a Simple Moving Average, providing a baseline for price movement.
Z-Score: Measures the number of standard deviations the current price is from the SMA. This is crucial for identifying extreme price movements.
Formula: Z-Score = (Current Price - SMA) / Standard Deviation
Signal Generation:
Buy Signal: Generated when the Z-Score falls below a predefined threshold, suggesting the price is significantly below its mean and potentially undervalued.
Sell Signal: Triggered when the Z-Score exceeds another threshold, indicating the price is significantly above its mean and possibly overvalued.
Visual Indicators:
SMA Line: Plotted in blue on the chart for easy reference.
Z-Score Line: Available but hidden by default, can be shown if needed for deeper analysis.
Buy/Sell Signals: Represented by green up-arrows for buy signals and red down-arrows for sell signals.
Background Color: Changes to green or red subtly to indicate buy or sell zones based on Z-Score thresholds.
Z-Score Label: Provides the numerical Z-Score for each bar, aiding in precise decision-making.
Customizable Parameters:
SMA Length: Adjust the period over which the SMA is calculated.
Lookback Period: Set the number of periods for calculating the standard deviation and Z-Score.
Buy/Sell Z-Scores: Thresholds for generating buy and sell signals can be tailored to your strategy or market conditions. FX:EURUSD FX:EURUSD
Usage Tips:
This indicator is best used in conjunction with other forms of analysis for confirmation. Mean reversion does not always hold in trending markets.
Adjust the Z-Score thresholds based on asset volatility for more or less frequent signals.
Backtest with historical data to optimize settings for your specific trading approach.
Note: While this indicator can help identify potential trading opportunities based on statistical anomalies, it does not guarantee success and should be part of a broader trading strategy that includes risk management and market context understanding.
B-Xtrender Simplified-BUY/SELL print Thanks to @puppytherapy for creating the original B-Xtrender indicator, available at this link: B-Xtrender by Puppytherapy.
This is a modified version of the original script, which now includes Buy and Sell arrows directly plotted on the chart for clear entry signals. The core logic of the indicator remains intact, with enhancements for simplicity and usability.
Overview:
The B-Xtrender Simplified indicator is a trend-following tool designed to identify potential buy and sell opportunities based on momentum and trend confluence. It combines short-term and long-term RSI-based oscillators with exponential moving averages to detect trend shifts and provide clear, actionable signals on the chart.
This simplified version focuses on clean visuals and provides buy and sell signals using arrows, ensuring an uncluttered chart. The indicator is suitable for traders who want a straightforward tool to assist with entry signals in trending markets.
Key Components:
Short-Term Oscillator:
Measures short-term momentum using the RSI of the difference between two EMAs (Short - L1 and Short - L2).
Provides early signals for trend reversals and momentum shifts.
Long-Term Oscillator:
Evaluates broader trend strength using the RSI of a single EMA (Long - L1).
Acts as a filter to ensure signals align with the overall market trend.
Smoothed Oscillator (T3):
Applies a smoothing algorithm to the short-term oscillator to reduce noise.
Ensures the signals are more reliable and less prone to false alarms.
How It Works:
Buy Signal (Green Arrow Below Candles):
Triggered when:
The short-term oscillator is above 0 (indicating upward momentum).
The smoothed short-term oscillator (maShortTermXtrender) is rising (momentum confirmation).
The long-term oscillator is above 0 (trend confirmation).
Sell Signal (Red Arrow Above Candles):
Triggered when:
The short-term oscillator is below 0 (indicating downward momentum).
The smoothed short-term oscillator (maShortTermXtrender) is falling (momentum confirmation).
The long-term oscillator is below 0 (trend confirmation).
Alerts:
Buy and sell signals generate alerts for traders to take immediate action when conditions are met.
Customization Options:
Short-Term Parameters:
Short - L1, Short - L2, Short - L3 control the responsiveness of the short-term oscillator.
Long-Term Parameters:
Long - L1, Long - L2 adjust the sensitivity of the long-term trend filter.
Default values ensure the indicator works effectively in most market conditions, but they can be fine-tuned for specific instruments or timeframes.
Strengths:
Clarity: Uses clean buy/sell arrows for visual simplicity.
Confluence-Based: Ensures alignment between short-term momentum and long-term trend before signaling.
Real-Time Alerts: Alerts for both buy and sell signals allow for timely decision-making.
Usage Tips:
Confirm Trend:
Use the indicator on a higher timeframe (e.g., 1-hour or daily) to confirm the overall trend direction.
Combine with Other Tools:
Enhance accuracy by combining the indicator with support/resistance levels, volume analysis, or other technical indicators.
Risk Management:
Always use stop-loss orders to protect against adverse market movements.
Maintain a risk-to-reward ratio of at least 1:2.
Ideal For:
Traders seeking clear and straightforward entry signals.
Trend-following strategies in liquid markets.
Beginners who want an easy-to-interpret tool for identifying momentum-based trades.
This simplified version of the B-Xtrender retains the original power of the indicator while focusing on clean visuals and actionable signals for trend-following traders.

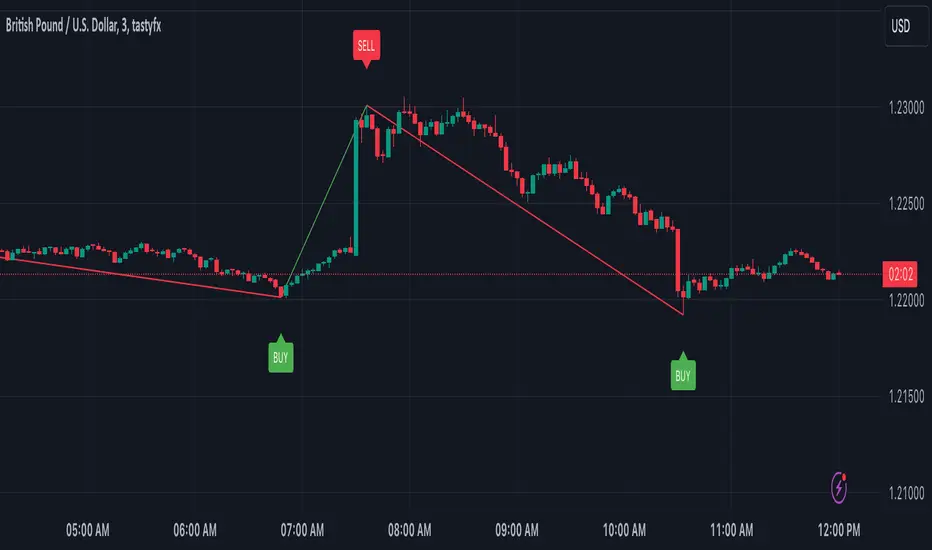
Daily Manipulation and Distribution Levels with Buy/Sell SignalsIndicator Summary:
This indicator is designed for intraday traders, highlighting key price levels and providing simple buy/sell signals based on price manipulation and distribution concepts.
Key Features:
Core Levels:
Manipulation Plus/Minus: Derived from the daily open and a portion of the daily range (e.g., 25%).
Distribution Levels: Daily high and low serve as ultimate targets or resistance/support levels.
Buy and Sell Signals:
Buy Signal: Triggered when the price crosses above the Manipulation Plus level. A green "BUY" label marks the entry.
Sell Signal: Triggered when the price crosses below the Manipulation Minus level. A red "SELL" label marks the entry.
Clean Chart Design:
Hides unnecessary clutter, showing only relevant key levels and labeled signals for clarity.
How to Use:
Entry Points:
Buy Entry: When a green "BUY" label appears after the price breaks above the Manipulation Plus level.
Sell Entry: When a red "SELL" label appears after the price breaks below the Manipulation Minus level.
Exit Strategy:
Take Profit: Use the Distribution Levels (daily high/low) as take-profit zones.
Stop Loss: Set just above/below the Manipulation Levels to manage risk effectively.
One to Two Trades per Session: Focus on high-probability moves to ensure clarity and reduce overtrading.
Who It’s For:
This indicator is ideal for traders seeking a structured and visual approach to intraday trading, with clear entry/exit criteria based on price manipulation and distribution theory. It simplifies decision-making and ensures clean chart setups without overwhelming visuals.